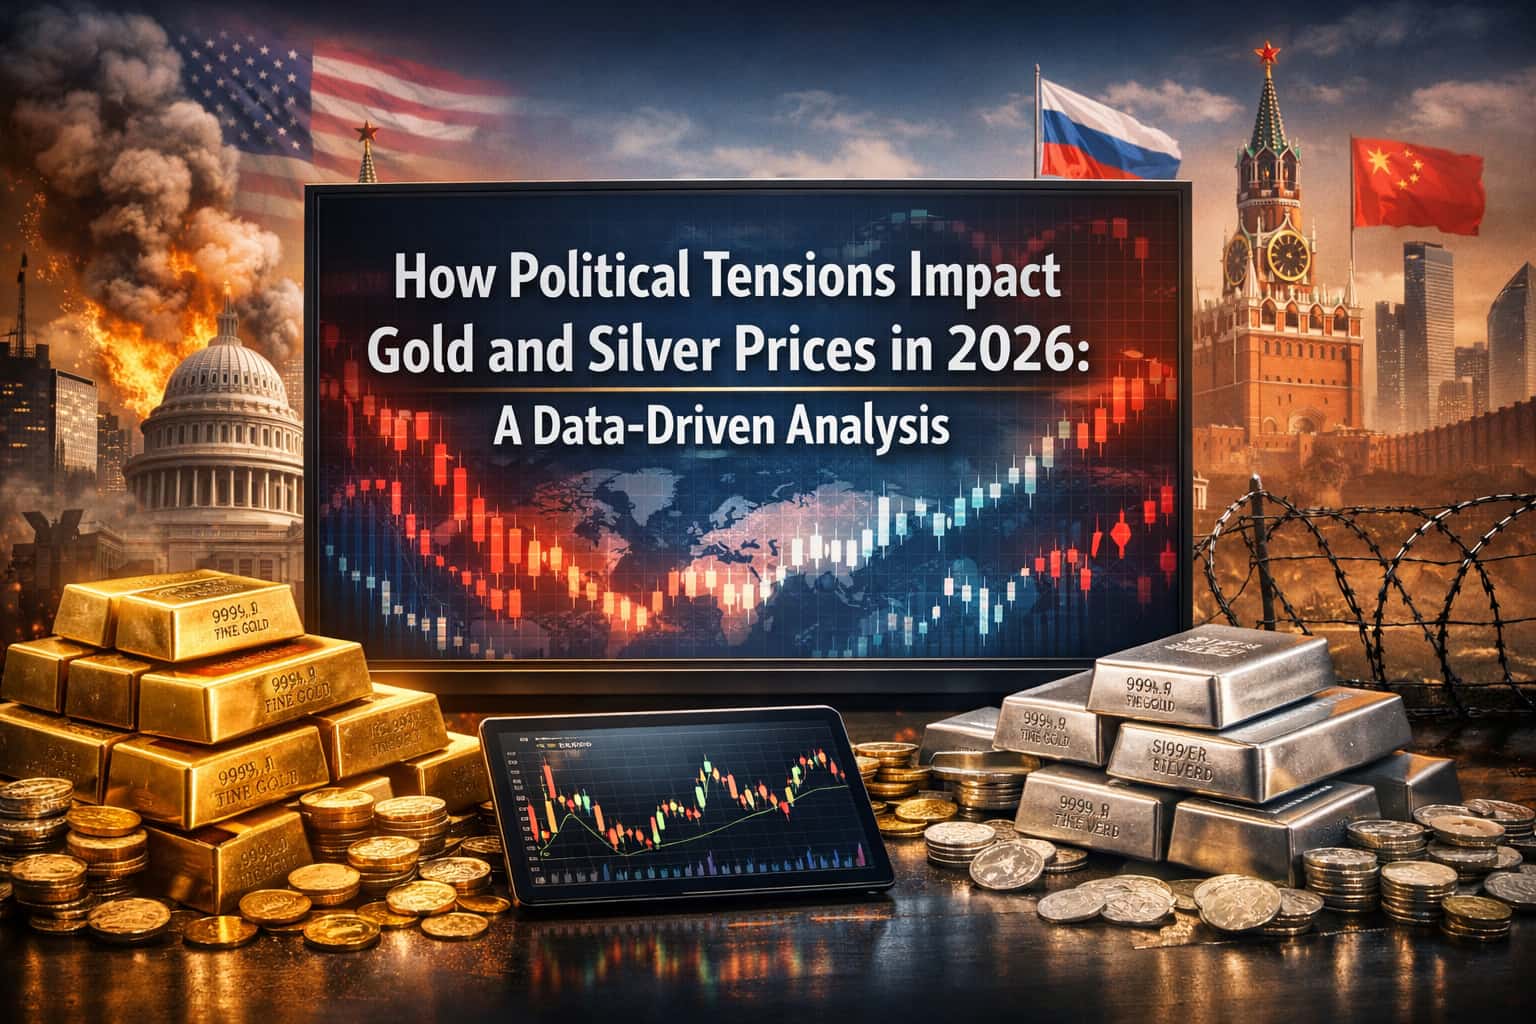
The precious metals market entered 2026 with exceptional momentum, as gold and silver prices surged sharply during January, reaching historically elevated levels amid heightened geopolitical tensions, economic uncertainty, and strong demand for safe-haven assets. This rapid rally attracted significant investor interest and pushed both metals into overextended territory within a short period of time.
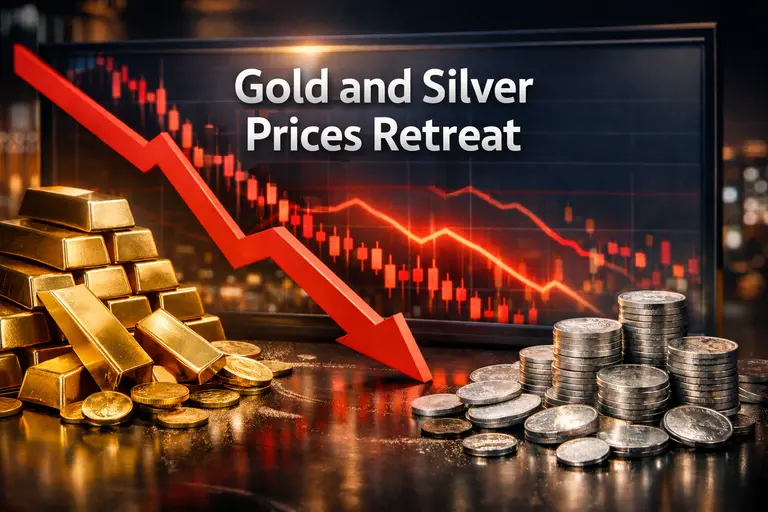
However, as January drew to a close, market dynamics shifted. Gold and silver prices retreated from their peaks, prompting widespread questions among investors and market observers: Was this pullback a healthy correction after an extraordinary rally, or the beginning of a broader trend reversal?
In this analytical report, we examine what happened to gold and silver prices at the end of January 2026, outline the key drivers behind the pullback, and explain what these movements may mean for investors and traders going forward.
How Did Gold and Silver Prices Move During January 2026?
January 2026 was marked by unusually strong price action in the precious metals market. Gold and silver both experienced rapid gains during the first half of the month, followed by a noticeable shift in momentum toward the end of January.
Strong Rally in the First Half of the Month
At the start of 2026, gold prices advanced aggressively as global uncertainty increased. Rising geopolitical risks, concerns over economic policy, and volatile financial markets reinforced gold’s role as a safe-haven asset. This momentum pushed gold prices toward historically high levels by mid-January, following substantial gains achieved in a relatively short time.
Silver followed a similar path but with greater volatility, benefiting from both investment demand and its industrial use. The simultaneous surge in gold and silver reflected a broad-based move into precious metals, signaling strong risk-averse sentiment across global markets.
Market Turning Point Toward the End of January
As prices reached elevated levels, upward momentum began to slow. By late January, price volatility increased, and both gold and silver entered a corrective phase. Gold retreated from its peak levels, while silver—typically more sensitive to changes in liquidity and sentiment—experienced sharper pullbacks.
From a market perspective, this shift was not unexpected. Sharp rallies are often followed by periods of consolidation or correction, particularly when prices move far above historical averages in a short time frame.
Price Peaks Before the Pullback
Before entering a corrective phase toward the end of January 2026, gold and silver prices had already recorded exceptional gains, reaching levels that made a pullback increasingly likely from a market and technical perspective.
Where Did Gold Prices Peak?
At the beginning of January 2026, gold prices were trading around the USD 4,300–4,400 per ounce range. As risk aversion intensified and demand for safe-haven assets accelerated, prices moved sharply higher over a short period of time.
By mid-January, gold surged to near USD 5,600 per ounce, marking one of the strongest rallies in modern precious metals history. This move represented a gain of roughly 30% from early-month levels, pushing prices far above historical averages and signaling an overheated market condition.
Such rapid appreciation naturally attracted profit-taking activity, particularly from institutional investors and funds that had accumulated positions earlier in the rally.
How Far Did Gold Pull Back?
As January approached its end, profit-taking pressure intensified, and gold prices retreated from their peak near USD 5,600. Prices declined to below the USD 5,000 per ounce level, reflecting a pullback of approximately 10%–12% from the monthly high.
Despite this decline, gold prices remained significantly higher than where they began the month, reinforcing the view that the move was corrective rather than a breakdown in trend.
Silver’s Role in Confirming Market Excess
Silver mirrored gold’s rally but with even greater volatility. During January, silver prices accelerated sharply, climbing toward the USD 120 per ounce area at the height of the rally—driven by strong investment flows and ongoing industrial demand.
As the broader precious metals market entered correction mode, silver pulled back more quickly, retreating to around USD 112 per ounce by late January. This represented a decline of roughly 6%–7% from peak levels, consistent with silver’s historically higher sensitivity to liquidity shifts and profit-taking.
What Do These Numbers Tell Us?
- Gold
- Early January: ~USD 4,300–4,400
- Mid-January peak: ~USD 5,600
- Late January: below USD 5,000
- Pullback magnitude: ~10%–12%
- Silver
- Peak level: ~USD 120
- Late January: ~USD 112
- Pullback magnitude: ~6%–7%
These figures clearly show that the late-January decline in gold and silver prices occurred after an extraordinary rally, leaving prices well above their early-month levels. From a broader perspective, the pullback reflects market rebalancing after excess momentum, rather than a loss of underlying strength in precious metals.
Why Did Gold and Silver Prices Fall at the End of January 2026?
The pullback in gold and silver prices during the final days of January 2026 was not driven by a single factor. Instead, it resulted from a combination of market, economic, and behavioral forces that converged after an exceptionally strong rally.
1) Profit-Taking After a Historic Rally
After gold surged from the USD 4,300–4,400 range to near USD 5,600 per ounce in a matter of weeks, many investors—particularly institutional funds—moved to lock in profits. Gains of this magnitude over a short time frame often trigger selling pressure, especially as portfolios are rebalanced near month-end.
This wave of profit-taking created natural downward pressure on prices, pushing gold and silver off their highs without signaling a loss of confidence in the metals themselves.
2) Temporary Decline in Safe-Haven Demand
During the same period, markets began to price in a partial easing of geopolitical tensions and a shift toward a more stable risk environment. As global uncertainty moderated, demand for traditional safe-haven assets—including gold and silver—temporarily softened.
This change in sentiment encouraged some market participants to reduce exposure to precious metals, contributing to the late-January pullback.
3) U.S. Monetary Policy Expectations and Dollar Strength
Another key driver was the growing expectation of a more restrictive U.S. monetary policy stance. Rising speculation around leadership changes at the Federal Reserve and a potentially more hawkish approach supported the U.S. dollar.
Because gold and silver are priced in dollars, a stronger dollar tends to pressure precious metals, making them more expensive for non-dollar buyers and reducing short-term demand.
4) Technical Overextension and Market Exhaustion
From a technical perspective, both gold and silver had moved far above their historical averages, placing the market in an overbought condition. Such extensions are rarely sustainable without pauses or corrections.
Silver, which typically exhibits greater volatility than gold, reacted more quickly to this overextension, reinforcing the corrective move across the broader precious metals complex.
5) Liquidity Pressures from Other Financial Markets
Heightened volatility in equity markets during late January also played a role. As stocks experienced sharp swings, some investors sold portions of their gold and silver holdings to raise liquidity, cover losses elsewhere, or rebalance portfolios.
This cross-market liquidity effect intensified selling pressure, particularly in silver, which is more sensitive to changes in investor positioning.
Summary of the Key Drivers
- Sharp profit-taking after a rapid and historic rally
- Temporary reduction in safe-haven demand
- Stronger U.S. dollar driven by monetary policy expectations
- Technical overbought conditions
- Liquidity-driven selling linked to equity market volatility
Together, these factors explain why gold and silver prices retreated toward the end of January 2026, despite remaining well above early-month levels.
Was This a Healthy Correction or the Start of a Downtrend?
After reviewing the price action and underlying drivers behind the late-January pullback, the critical question remains:
Was this move a normal market correction, or the beginning of a broader bearish trend?
Why the Evidence Supports a Healthy Correction
Several key indicators suggest that the late-January decline in gold and silver prices should be viewed as a healthy correction, rather than a structural trend reversal.
First, despite pulling back from their peaks, both metals remained significantly above their early-January levels. Gold, which started the month near the USD 4,300–4,400 range, ended January below USD 5,000 but still far higher than where the rally began. This behavior is characteristic of corrective phases following sharp advances.
Second, the fundamental drivers that fueled the rally did not disappear. Geopolitical uncertainty, monetary policy risks, and broader market volatility remained present, continuing to support long-term interest in precious metals.
Third, the pullback followed a rapid and extended rally, during which prices moved far beyond historical norms. Corrections under such conditions are not only expected but necessary to restore balance and sustainability in the market.
When Would the Pullback Become Concerning?
While the current evidence favors a corrective interpretation, certain developments could signal a shift toward a more negative outlook if they were to materialize:
- A prolonged period of selling pressure without signs of stabilization
- A decisive change in global monetary policy that materially reduces the appeal of precious metals
- A sustained improvement in global risk sentiment that draws capital away from safe-haven assets
- A deeper breakdown below key support zones accompanied by weakening investor confidence
Absent these conditions, the late-January move appears consistent with market rebalancing rather than trend deterioration.
Correction vs. Downtrend: Understanding the Difference
To put the move into perspective:
- A correction typically follows a strong rally, is limited in scope, and does not alter the broader market structure.
- A downtrend involves sustained lower prices, deteriorating fundamentals, and reduced investor demand over time.
Based on price behavior and market context through the end of January 2026, gold and silver price action aligns more closely with the first scenario.
What This Means for Investors and Traders
Following the sharp rally in early January and the subsequent pullback toward month-end, many investors are now reassessing how to approach the precious metals market. The recent price action carries different implications depending on investment horizon, risk tolerance, and objectives.
How Investors Typically Navigate High-Volatility Phases
Periods of heightened volatility often require strategy over timing. Rather than attempting to predict exact tops or bottoms, experienced investors tend to focus on risk management and position sizing:
- Phased entry strategies are commonly used to reduce exposure to short-term fluctuations.
- Long-term positions are usually evaluated based on underlying fundamentals rather than short-term price movements.
- Corrections following strong rallies are often viewed as part of the market cycle rather than a signal to exit entirely.
In this context, the late-January pullback appears consistent with a market resetting after excess momentum.
Is the Pullback an Opportunity or a Risk?
The answer depends largely on the investor’s time horizon:
- For long-term investors:
Pullbacks after strong rallies may offer opportunities to reassess positioning, particularly if the broader drivers supporting gold and silver remain intact. - For short-term traders:
Risk remains elevated, as prices may continue to fluctuate while the market searches for a new equilibrium. Discipline and clear risk parameters are essential. - For non-investment buyers:
Short-term volatility is often less relevant, especially in physical markets where pricing also reflects fabrication costs and local demand dynamics.
Gold vs. Silver: Understanding Sensitivity Differences
While gold and silver often move in the same direction, their behavior during corrections can differ meaningfully:
- Gold generally exhibits greater price stability and is primarily used as a store of value and hedge against uncertainty. Its corrections tend to be more measured.
- Silver, by contrast, is more volatile due to its dual role as both an investment asset and an industrial metal. As a result, silver often experiences larger percentage swings during both rallies and pullbacks.
Recognizing these differences can help investors align their exposure with their risk tolerance and market expectations.
Impact on Local Markets (UAE and the Gulf)
Global movements in gold and silver prices are typically transmitted quickly to regional markets, particularly in the Gulf, where local pricing is closely linked to international spot prices.
Impact on the UAE Gold Market
In the UAE, the late-January pullback in global gold prices translated into moderate local price adjustments rather than sharp declines. Investment-grade gold—such as bars and coins—reacted more directly to the correction, while jewelry prices, especially 21K gold, showed greater resilience due to fabrication costs and steady consumer demand.
Notably, investment demand in the UAE remained active during the pullback. Many buyers viewed the correction as a price normalization phase, rather than a bearish signal, particularly given the strong performance earlier in the month.
Investment vs. Consumer Demand Dynamics
Local market behavior highlighted a clear distinction between two demand segments:
- Investment demand responded quickly to changes in global prices, particularly for high-purity gold products with lower fabrication premiums.
- Consumer demand for jewelry remained relatively stable, as purchasing decisions are often influenced by personal use, gifting, and seasonal considerations rather than short-term price movements.
Silver’s Performance in Regional Markets
Silver prices in local markets reflected the same corrective pattern seen globally, though with greater sensitivity due to silver’s higher volatility. Despite this, interest in silver as a lower-cost alternative to gold remained intact, particularly among investors seeking higher price movement potential.
Overall, silver’s regional performance reinforced the broader narrative: the late-January decline represented price adjustment, not a collapse in demand.
Outlook After the End of January 2026
As February begins, the precious metals market appears to be transitioning from a period of rapid appreciation to one of reassessment and consolidation.
Market participants are likely to focus on:
- Geopolitical developments and their impact on safe-haven demand
- Signals from U.S. monetary policy and currency movements
- Broader financial market volatility and liquidity conditions
If supportive conditions persist, gold and silver may retain a constructive medium-term outlook, even as short-term price swings remain elevated.
Final Conclusion
The retreat in gold and silver prices at the end of January 2026 was not a sign of structural weakness, but rather a natural correction following an extraordinary rally. Despite pulling back from record highs, both metals closed the month at levels well above where they began, preserving strong monthly gains.
This behavior reflects a market moving from momentum-driven expansion into a phase of rebalancing and stabilization—a normal and often necessary part of any sustained upward cycle. As long as the underlying drivers supporting precious metals remain in place, gold and silver are likely to continue playing a central role in investor portfolios, with volatility remaining a defining feature of the near-term landscape.